Over the Past 1000 Years

|
Over the Past 1000 Years |
|
|
| Thomas J. Crowley |
| Abstract: Recent reconstructions of northern hemisphere temperatures and climate forcing over the last 1000 years allow the warming of the 20th century to be placed within a historical context and various mechanisms of climate change to be tested. Comparison of observations with simulations from an energy balance climate model indicate that as much as 41-64% of pre-anthropogenic (pre-1850) decadal-scale temperature variations were due to changes in solar irradiance and volcanism. Removal of the forced response from reconstructed temperature time series yields residuals that show similar variability to control runs of coupled models, thereby lending support to the models' value as estimates of low-frequency variability in the climate system. Removal of all forcing except greenhouse gases from the ~1000 year time series results in a residual with a very large late 20th century warming that closely agrees with the response predicted from greenhouse gas forcing. The combination of a unique level of temperature increase in the late 20th century and improved constraints on the role of natural variability provides further evidence that the greenhouse effect has already established itself above the level of natural variability in the climate system. A 21st century global warming projection far exceeds the natural variability of the last 1000 years and is greater than the best estimate of global temperature change for the last interglacial. |
| Links to Paper
Sources: Published July 14, 2000 Science, 289: 270-277. http://www.science.com/ View the data plotted in figure 1 , figure 2 , figure 3 , and figure 4 . Note that the Volcanic Forcing Time Series are not adjusted for 30% albedo of the earth-atmosphere system, whereas the solar forcing numbers are for net radiative forcing (AFTER THIS 30% ADJUSTMENT). April 2001 versions of estimates of volcano, solar, greenhouse
gas, and tropospheric (1000-1998) total forcing prior to accounting for
the planetary albedo affect can be downloaded
here. |
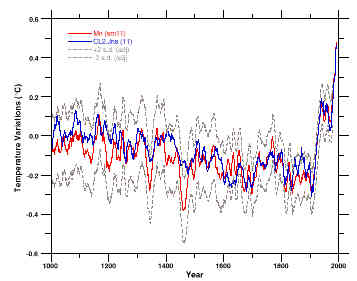
| Figure
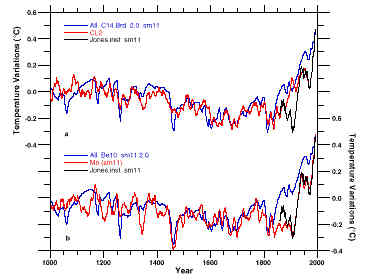
1: Comparison of decadally smoothed Northern Hemisphere mean and annual temperature records for the past millennium (1000-1993), based on reconstructions of Mann et al. (Mn) (11) and CL (12). The latter record has been spliced into the 11-point smoothed instrumental record (16) in the interval in which they overlap. CL2 refers to a new splice that gives a slightly better fit than the original (12). The autocorrelation of the raw Mann et al. time series has been used to adjust (adj) the standard deviation units for the reduction in variance on decadal scales. |
 |
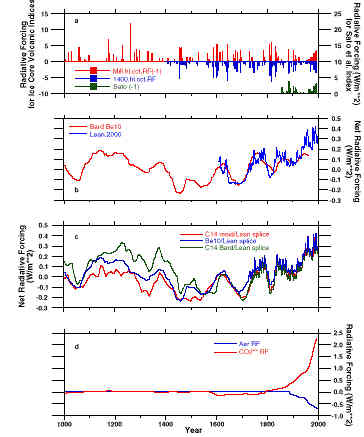
| Figure
2: Forcing time series (W/m**2, note scale changes for different panels) used in model runs: (A) ice core millennial volcanism time series from this study; ice-core Robcock and Free (19) reconstruction from 1400 to the present after adjustments discussed in (9) and (25); and Sato et al. (28) Northern Hemisphere radiative forcing, updated to 1998. (B) Example of splice for solar variability reconstructions, using the 10Be based irradiance reconstruction of (30) and the reconstruction of solar variability of Lean et al.. (C) Comparison of three different reconstructions of solar variability based on 10Be measurements (30), 14C residuals (31), and calculated 14C changes based on 10Be variations (30); (D)Splice of CO2 radiative forcing changes 1000-1850 (35) and post-1850 anthropogenic changes in equivalent greenhouse gas forcing and tropospheric aerosols. |
 |
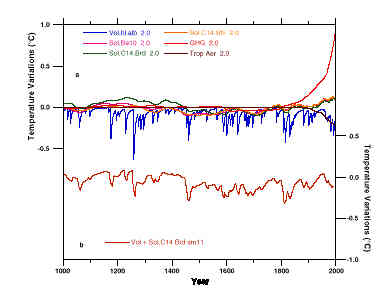
| Figure 3:
(A) Model response to different forcings, calculated at a sensitivity of 2.0°C for a doubling of CO2; (B) Example of the combined effect of volcanism volcanism and solar variability (with 11-point smoothing), using the Bard et al. (30) 14C index. |
 |
| Figure
4: Comparison of model response using all forcing terms (with a sensitivity of 2.0 C) against (A) the CL (12) data set spliced into the 11-point smoothed Jones et al. (16) Northern Hemisphere instrumental record, with rescaling as discussed in the text and in the Fig. 1 caption; and (B) the smoothed Mann et al. (11) reconstruction. Both panels include the Jones et al. instrumental record for reference. To illustrate variations in the modeled response, the 14C calculation from Bard et al. (30) has been used in (A) and the 10Be estimates from (30) have been used in (B). |
 |
| Figure
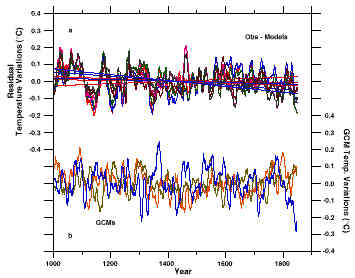
5: Analysis of preanthropogenic residuals in the paleo records. (A) Estimates of residuals using all combinations of temperature reconstructions and total forcing (including three different solar indices), with trend lines fitted for each of the six residuals. (B) Control runs (detrended) from three different coupled ocean-atmosphere models (46): the NOAA/GFDL, the HadCM3, and the ECHAM3/LSG. For the sake of comparison with the paleo data, the GCM runs have been truncated to the same length as the paleo residuals and have been plotted using the arbitrary starting year of 1000. |
 |
| Figure
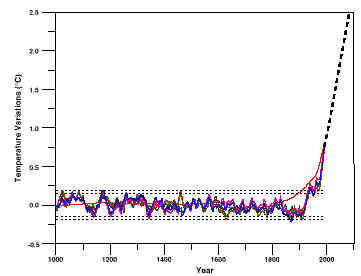
6: Comparison of the GHG forcing response (from Fig. 3) with six residuals determined by removing all forcing except GHG from the two different temperature reconstructions in Fig. 1. As in Fig.5, the three different estimates of solar variability were used to get one estimate of the uncertainty in the response. This figure illustrates that GHG changes can explain the 20th century rise in the residuals; +/-2 standard deviation lines (horizontal dashed lines) refer to maximum variability of residuals from Fig. 5A (inner dashes) and maximum variability (outer dashes) of the original pre-1850 time series (Fig 1). The projected 21st century temperature increase (heavy dashed line at right) uses the IPCC BAU scenario (the "so called IS92a forcing")(59) for both GHG and aerosols (sulfate and biomass burning, including indirect effects), and the model simulation was run at the same sensitivity (2.0 C for a doubling of CO2) as other model simulations in this article. |
 |
| Contact Us NOAA Paleoclimatology Program Home Page National Oceanic and Atmospheric Administration 14 July 2000 |
 |